No complex integrations. No weeks of setup. No technical expertise required. Sense works the way event operations should: deploy fast, know now, act immediately.
Time: 2-4 hours for typical venue
Passive sensors scale by surface area. Place them throughout your space—entrances, key zones, activations, bottleneck areas. They detect anonymous device signals (WiFi, Bluetooth) without requiring attendees to connect to anything.
Works offline. No WiFi infrastructure required. No app downloads. No attendee friction.
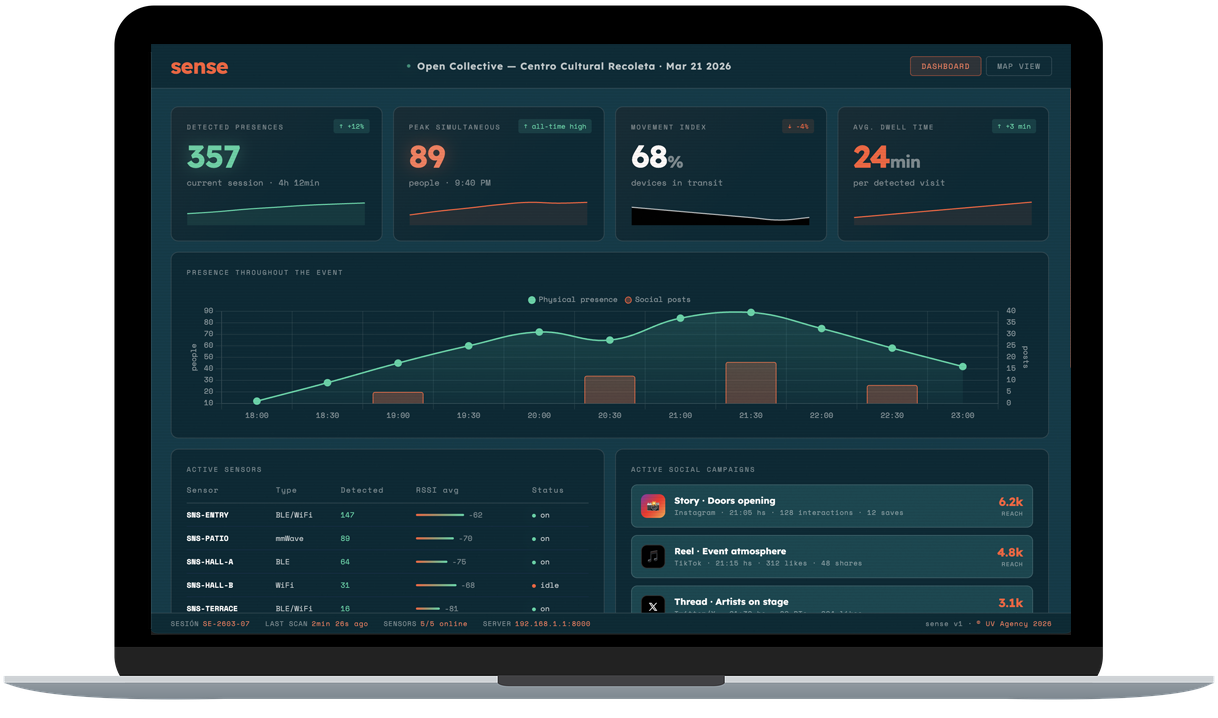
Live dashboards during your event
Access clean, simple dashboards showing heat maps, dwell time, crowd flow, and peak hours as they happen. See bottlenecks forming, dead zones emerging, and traffic patterns shifting in real-time.
No data science degree required. No complex analytics. Just clear metrics you can act on.
Fix problems while the event is running
20-minute line at registration? Move staff. Dead zone in the back corner? Relocate activations. Unexpected crowd surge? Adjust security positioning. Make operational decisions based on truth, not guesses.
This is where Sense pays for itself: preventing problems instead of just reporting on them.
Your data, your way
Export clean CSV files, generate PDF reports, access via API. Share with stakeholders, analyze in your own tools, prove value to sponsors, plan better events next time. No vendor lock-in.
Data you can actually use, in formats everyone understands.
Passive signal detection. Privacy by design. No cameras, no tracking, no creepiness.
Sense sensors passively detect anonymous device signals—WiFi probe requests and Bluetooth beacons that smartphones naturally emit when searching for networks. These signals are already being broadcast; Sense just listens.
No facial recognition. No cameras at all.
No personal data. No names, emails, phone numbers, or identifiable information.
No forced connections. Attendees don't need to connect to WiFi or download apps.
No tracking across venues. Data is anonymized and venue-specific.
Anonymous presence data: how many devices, where they are, how long they stay, when they return. Enough to understand crowd behavior and optimize operations. Not enough to identify individuals or violate privacy.
Visual representation of crowd concentration. Red zones = high traffic. Blue zones = low traffic. See bottlenecks and dead zones at a glance.
How long people stay in each zone. Are they engaging with your activation or just walking past? Measure actual interest, not just foot traffic.
Crowd size over time. See when surges happen, plan staffing accordingly, prevent overcrowding before it becomes a problem.
Track repeat visitors to specific zones. Understand loyalty, engagement, and which areas draw people back multiple times.
Visualize how crowds move through your space. Optimize layouts, improve signage, prevent congestion based on actual behavior.
CSV exports with timestamps, zone IDs, presence counts, dwell times. Clean data you can analyze in Excel, Tableau, or your own tools.
Venue walkthrough (virtual or in-person). Identify key zones, high-traffic areas, and bottleneck risks. Plan sensor placement. Ship hardware.
Deploy sensors (2-4 hours typical). Test connectivity, verify dashboard access, train operations team on using real-time data.
Monitor real-time dashboards. Make operational adjustments. Fix bottlenecks as they emerge. Optimize on the fly.
Export reports. Share insights with stakeholders. Analyze patterns for next time. Retrieve sensors (or leave deployed for ongoing use).
Sense deploys fast, works immediately, and delivers insights you can act on. No complexity. No delays. Just operational truth.